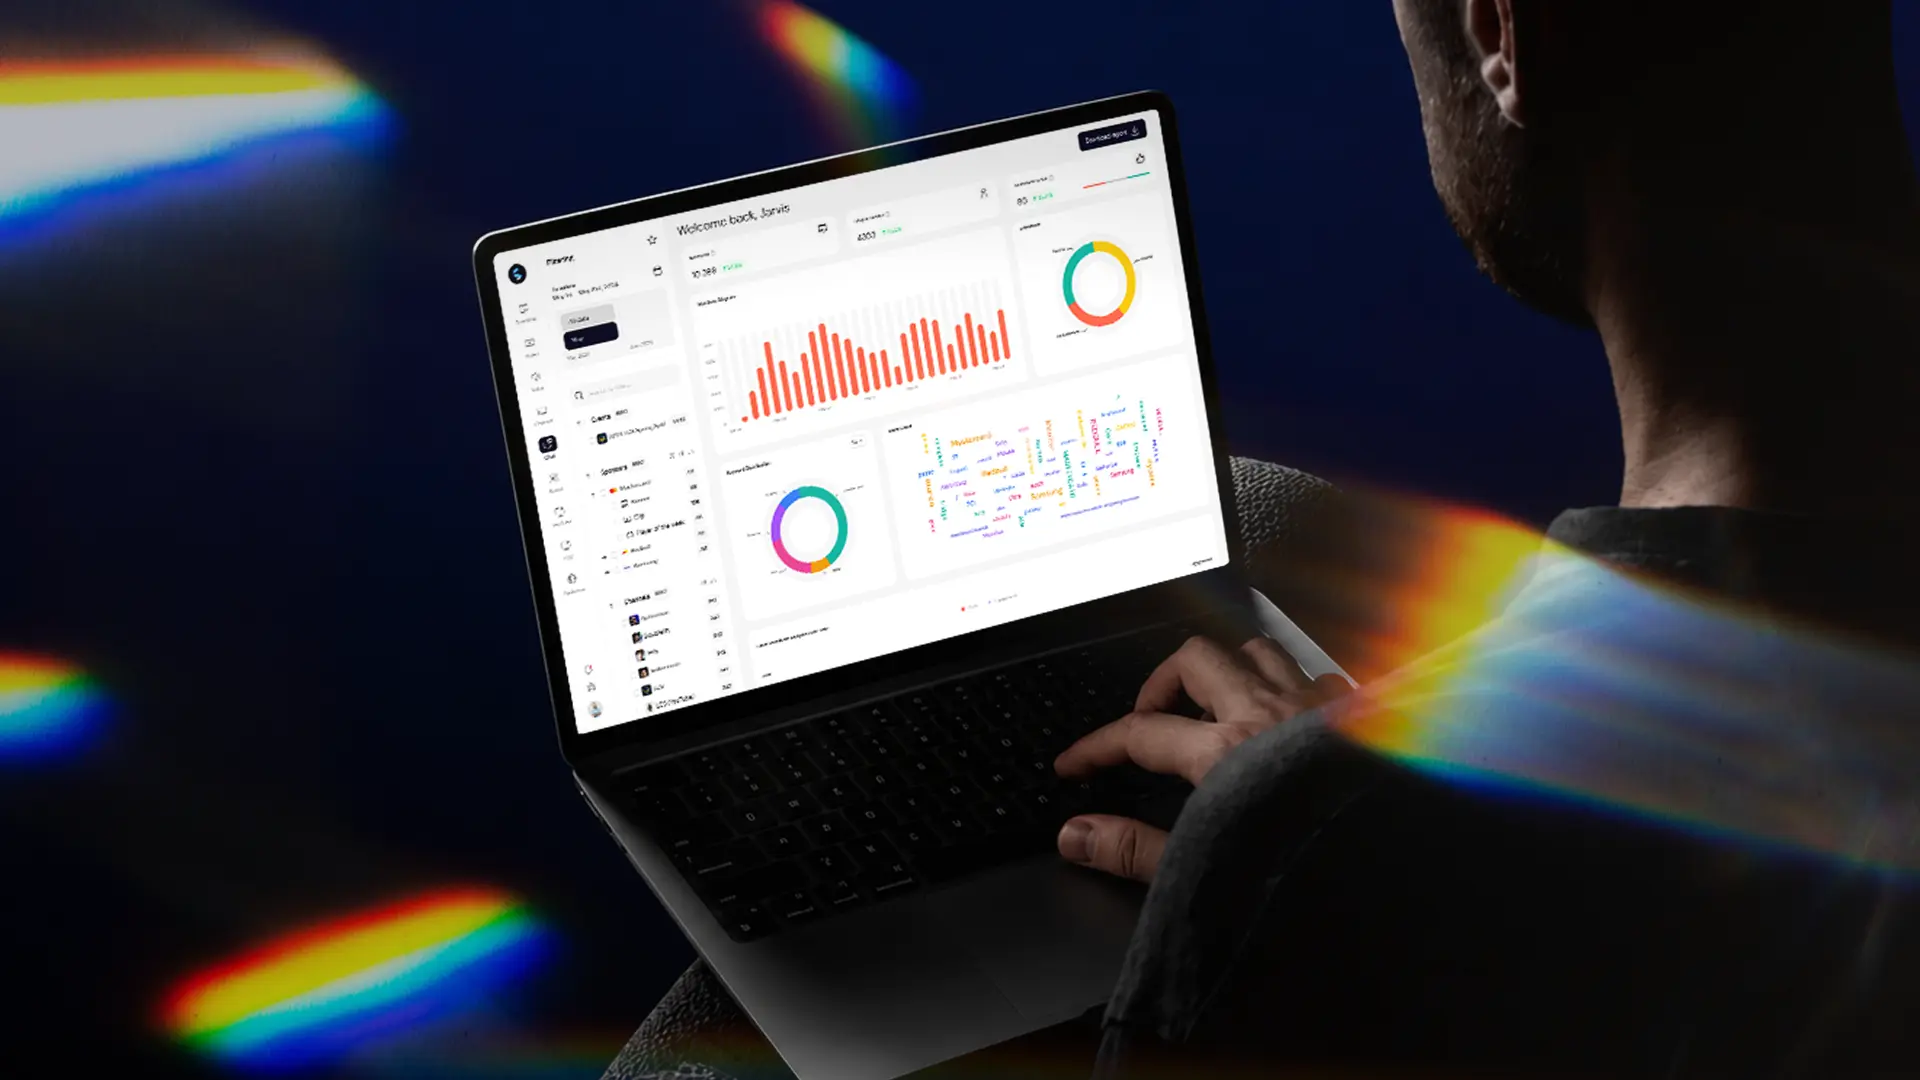

Every sponsorship analytics platform promises to prove ROI. The gap only shows up later, in the renewal meeting, when a sponsor asks a question the report cannot answer.
So the real decision is not which tool has the longest feature list. It is which one measures enough to hold up when the questions get specific. Here is how to tell them apart.
Analytics vs Management Software
Search for sponsorship software and two very different products answer to the same name. Management software runs the commercial pipeline: contracts, asset inventories, approvals, renewals. Analytics software does the harder job of measuring what an event actually delivered for a sponsor and turning it into a value figure.
The two get bought for different reasons. If you want a tidier sales process, management tooling fits. If you want to walk into a renewal with proof the last activation paid off, that is a measurement job. This guide is about that side.
For a deeper look at what comprehensive measurement covers, our companion guide on measuring event sponsorship impact breaks down each dimension.
The Four Dimensions Any Platform Must Cover
Coverage is the first filter, and the one buyers most often underweight. A tool can measure one channel beautifully and still leave real value uncounted. Before you look at anything else, hold each platform up against these four.
Cover all four and your report answers questions. Cover fewer and you leave gaps a sponsor will find before you do.
Beyond the Four: Capabilities That Separate Tools
Once coverage checks out, a second tier decides whether the data survives real scrutiny. These are the details that turn a competent dashboard into something you can build a renewal on.
Questions to Ask Before You Buy
A demo is where the promises meet reality. Take these into every evaluation and ask the vendor to answer each one on a real event, not a slide.
Can you measure across broadcast, streaming and social, or only the main feed?
Value spreads across every channel an event touches. If a platform only reads the primary broadcast, you will under-report to your sponsors without ever knowing by how much.
How do you score visual prominence, not just detect a logo?
A logo tucked in a corner is not worth one filling the frame. Tools that count appearances without weighting prominence hand you inflated numbers that fall apart the moment a sponsor looks closely.
Do you track spoken sponsor mentions, and in how many languages?
Commentary is exposure the camera never sees, and at global events it plays out in many languages at once. Miss it and an entire dimension of value goes unreported.
Is your audience data qualified, or an estimate?
Sponsors care who watched, not how many might have. A reach estimate dressed up as audience data leaves you making the renewal case on the sponsor's terms rather than your own.
Can you benchmark my brand against co-sponsors?
A number on its own says little; the same number next to the rest of the field tells a story. Without benchmarking you cannot prove a sponsor outperformed, which is often the whole point.
Can you explain how you calculate media value?
You will have to defend that figure in the room. If the vendor cannot walk you through the method, you will not be able to either, and a number nobody can explain is a number nobody trusts.
Our guide on how media value is calculated is a useful benchmark for a good answer.
How does the platform export and scale across a season?
Insight trapped in a dashboard never reaches the board deck. Check that the data leaves cleanly and that one tidy event does not become a manual scramble across a full calendar.
Red Flags to Watch For
The criteria tell you what good looks like. These are the warning signs that tend to surface mid-evaluation, when you know where to look.
The demo only ever shows the main broadcast
If every example is one polished broadcast clip, the streaming, social and co-cast coverage probably is not there. Ask to see a social clip and a regional feed measured in the same report, and watch how quickly the answer arrives.
Big numbers with nothing to compare them to
Impressive figures mean little without a benchmark. A platform that cannot place a sponsor's exposure against co-sponsors is handing you a number you cannot defend and a story you cannot tell.
"Audience" that turns out to be reach
This is the most common sleight of hand. An estimate of how many people could have watched is not a breakdown of who actually did, and sponsors know the difference even when a report blurs it.
A media value figure nobody can explain
If the honest answer to "how did you arrive at this?" is a shrug, treat it as a black box. A figure you cannot trace is a figure that will not survive a sceptical sponsor, and it puts your credibility on the line, not the vendor's.
What Full Coverage Looks Like in Practice
It is one thing to list criteria, another to see them hold up at scale. Here is how full-coverage measurement plays out on two very different events, one in esports, one in sport.
Esports at championship scale
The MOONTON Games M7 World Championship is one of the most-watched mobile esports events in the world, and it broadcasts everywhere at once, across feeds, languages and platforms.
Measuring it meant reading every channel together rather than sampling one. The result was €158 million in tracked media value, and competitive benchmarking that pinpointed how much of it flowed to the top few sponsor assets.
That is the kind of clarity a sponsor can renew on, and it only appears when nothing is left uncounted.
A whole tournament, measured
Scale changes the problem. For the 2026 FIFA World Cup, the picture had to span all 48 teams across six weeks, tens of thousands of posts and billions of impressions, mapping how attention and value moved between teams, players and sponsors.
It surfaced things a single-match view never could, including that the eventual winners were nowhere near the fastest-growing name of the tournament. That is the leap from measuring one event to reading an entire competition.
The Bottom Line
The best sponsorship analytics software is not the one with the most features. It is the one that measures enough of the event to answer whatever a sponsor asks next. Lead with coverage, pressure-test the methodology in a live demo, and let the data prove itself before you commit.
The best way to see the difference is to watch it run on a real event.

Frequently Asked Questions
What is the best sponsorship analytics software?
The best sponsorship analytics software is the one that measures across all four dimensions of an event, visual, audio, text and audience, rather than counting logos on a single feed. Match coverage to the events you run and confirm it in a demo. Shikenso measures all four from a single source, with competitive benchmarking built in.
What features should sponsorship analytics software have?
Look for prominence-based visual tracking, audio and commentary detection, earned-media capture, qualified audience demographics, competitive benchmarking, transparent media value methodology, clean exports and integrations. Feature count matters less than coverage across channels. Shikenso combines these so a single report answers the questions sponsors ask at renewal.
What is the difference between sponsorship analytics and sponsorship management software?
Sponsorship management software organises the commercial pipeline: prospecting, contracts, assets and approvals. Sponsorship analytics software measures what an event delivered for a sponsor and expresses it as value. Buyers who need to prove ROI at renewal need the analytics side. Shikenso focuses on measurement across every channel an event touches.
How do you evaluate sponsorship analytics software?
Evaluate on measurement coverage first, then benchmarking, audience granularity, methodology transparency and exports. Take a list of sponsor questions into the demo and ask the vendor to answer each on a real event. A platform that can show all four dimensions live is one you can build a renewal argument on. Shikenso is built for exactly that test.
What is the best sponsorship analytics software for sports and esports?
The best fit for sports and esports handles many simultaneous feeds, multiple languages and large social footprints without losing accuracy. Shikenso has measured value at championship scale in esports and across full tournaments in sport, covering broadcast, streaming and social together so nothing an event generates goes uncounted.
How much does sponsorship analytics software cost?
Pricing varies with the number of events, channels and depth of reporting rather than a single list price, so value is best judged against the media value a platform can prove. Understanding how media value is calculated makes it easier to weigh cost against return. Shikenso scopes to the events you run.
Related reads


Get new insights straight to your inbox
Don’t miss out on the insights that the press and media rave about!