
Most people think AI sponsorship analytics does one thing: find a logo on screen.
That assumption is costing the industry millions.
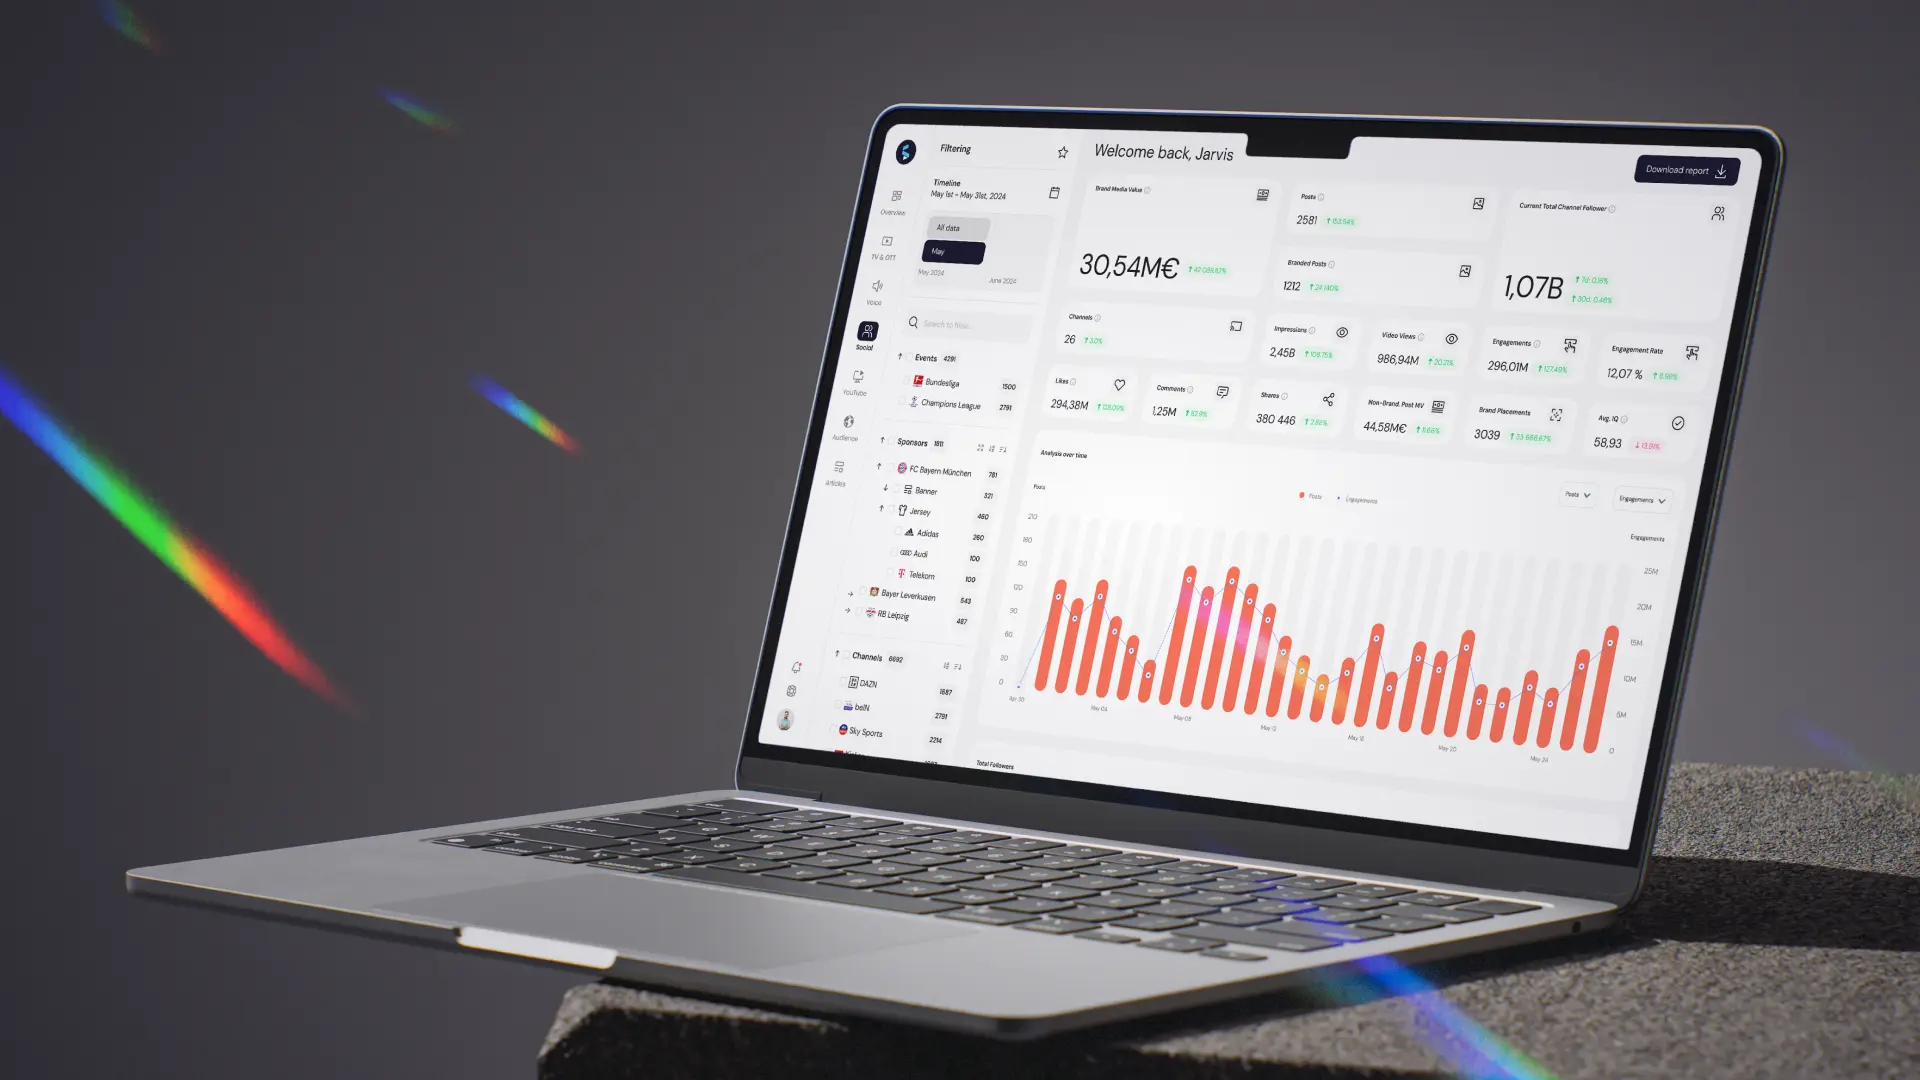
Modern platforms track far more than logos — they analyse what viewers see, hear, and read across every moment of a broadcast. And once you start measuring all three dimensions, what your sponsorship is actually worth looks very different.
The global sports sponsorship market is projected to surpass €122 billion by 2033. Yet only 19% of sponsorship professionals are confident they can actually measure the business value they're getting. At that market scale, the gap between what a sponsorship delivers and what gets reported has a real commercial cost.
Making data-driven sponsorship decisions requires knowing what a sponsorship analytics platform is actually measuring. There are four distinct dimensions.
Visual Tracking: More Than a Logo on a Screen
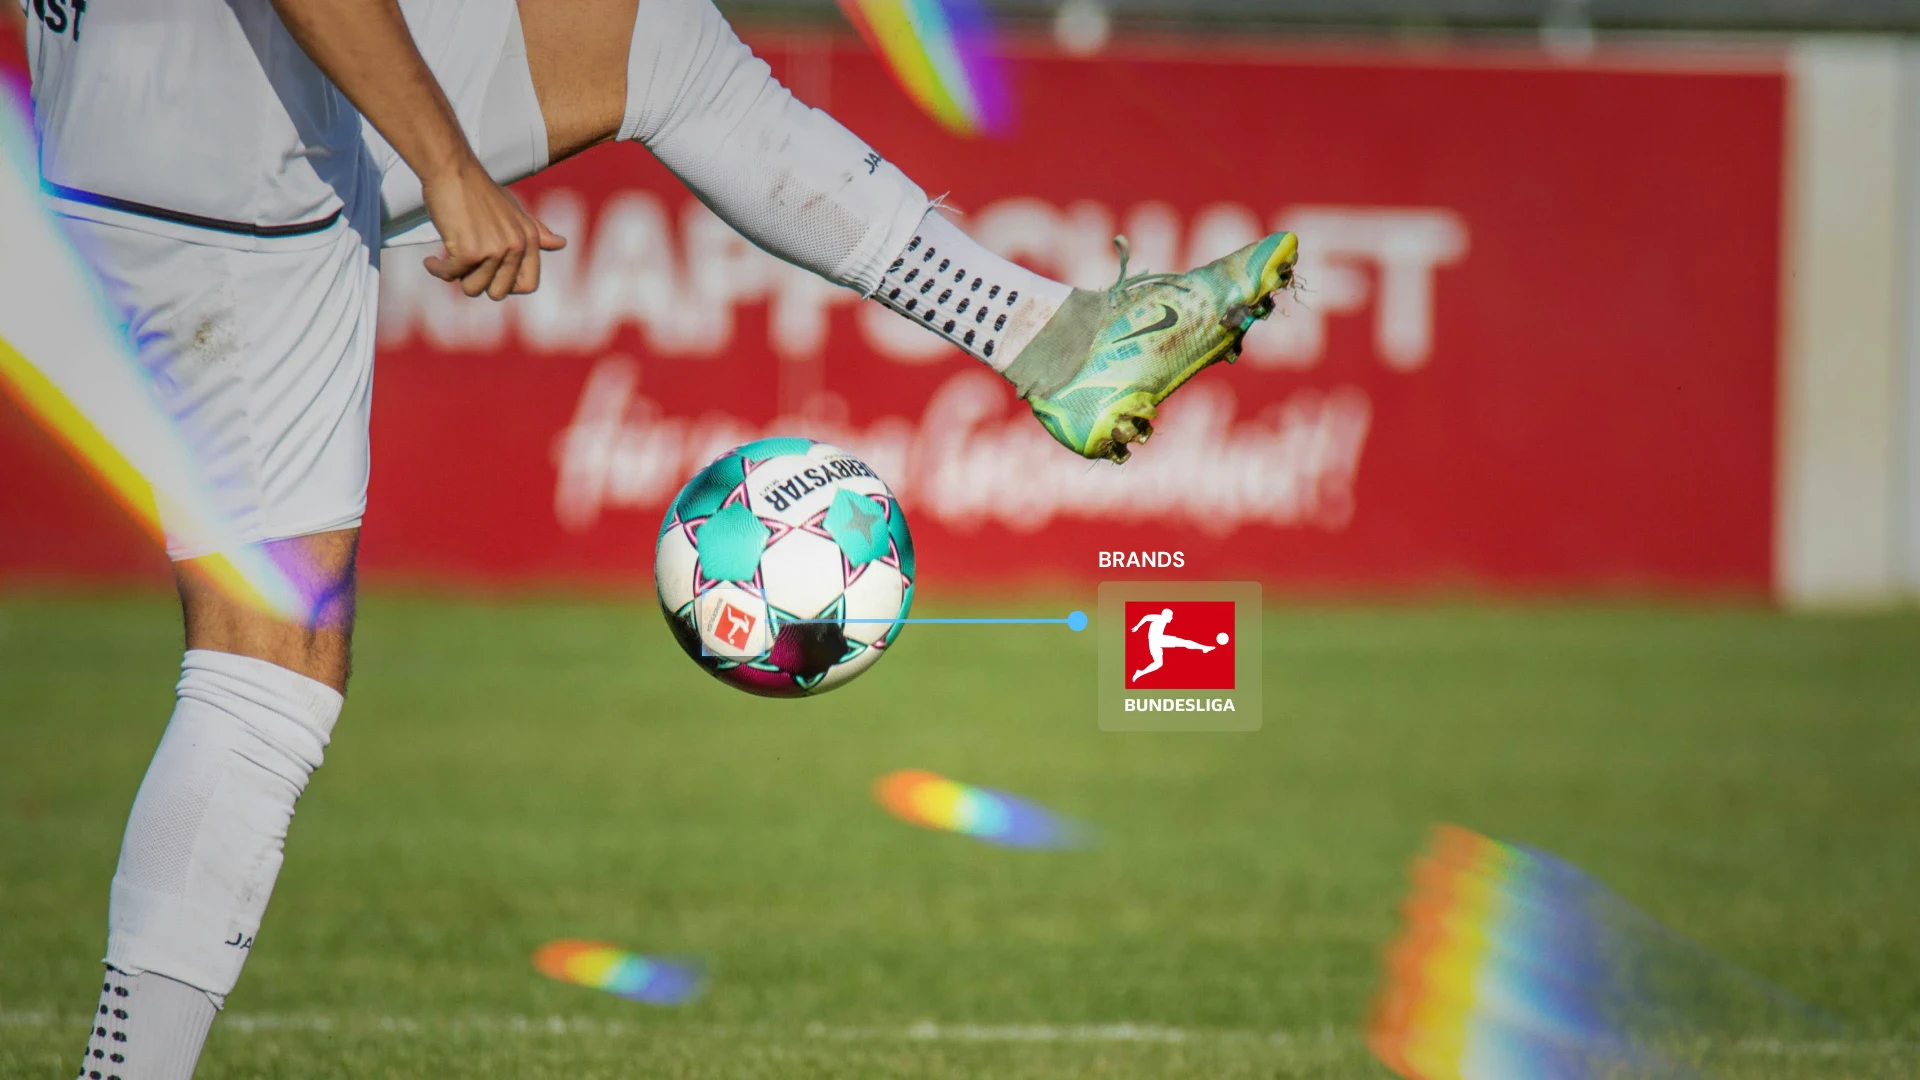
A modern artificial intelligence (AI) tracking system analyses every frame of a broadcast and captures considerably more than whether your logo was present. Placement, quality, asset type, and competitive context all feed into media value — and each one produces a different figure.
What visual tracking covers:
- Logo presence and position — foreground versus background, central versus peripheral frame placement, and whether the asset appears during high-viewership moments or dead-air passages
- Asset type classification — jersey patch, pitch-side board, digital LED, broadcast overlay, stadium banner — each tracked and valued independently
- Duration and frequency — cumulative screen time per asset type across the full broadcast, not aggregated into one blunt total
- Visibility quality scoring — is the logo in sharp focus, partially obscured, or at the edge of frame? Presence without clarity carries a different value
- Competitive share of screen — how much visual real estate your brand holds relative to co-sponsors appearing in the same content
Asset-level data shifts commercial conversations. Just like how GIANTX used tracking across their sponsorship placements to make data-driven decisions about which assets to scale — refining their sponsorship strategy to integrate 17 new brand partners into their portfolio.
Audible Tracking: The Channel Nobody Is Measuring
Audio is the most underestimated dimension of sponsorship measurement. A brand mentioned by name during a penalty shootout reaches every person watching — including those not looking at the screen. Without audio tracking, that exposure goes unrecorded entirely.
AI audio tracking captures:
- Commentator and presenter brand mentions — including sponsored segment hand-offs ("This half brought to you by…")
- Sponsored segment announcements: kick-off sponsors, VAR check sponsors, half-time break sponsors
- Brand name recognition across live crowd audio and post-match interview settings
- Multi-language processing — essential for any brand whose content airs across multiple markets simultaneously
- Sentiment analysis on audio — the tone in which a brand is mentioned matters commercially, particularly around high-drama moments
Consider the volume of audio content going untracked. The global esports streaming audience alone is projected to reach 664 million viewers by the end of 2025. At that volume, manually reviewing broadcasts for brand mentions across multiple markets has no realistic throughput. Shikenso's platform processes audio in over 200 languages, meaning a brand whose content airs across five European markets gets complete coverage, not a partial picture built on whichever broadcasts someone had time to review.
See what your sponsorship is actually delivering. Explore how Shikenso tracks visual, audio, and text exposure across every channel — in real time.
Legible Tracking: Text That Lives Beyond the Broadcast
Text-based brand exposure is uniquely persistent. Unlike a logo appearance that disappears when the camera cuts, on-screen text assets travel — into highlight clips, into social media posts, into replay content consumed days after the event has ended.
A jersey patch and a press conference backdrop are not the same asset. Grouping them under one exposure figure obscures which placements are actually working.
Audience Intelligence: Who Is Actually Watching?
Exposure volume and audience quality are two separate figures. Raw exposure data shows how many people a piece of content reached. Audience intelligence shows who those people actually were — their age, location, income bracket, and whether they matched the demographic the sponsor paid to access.
Audience intelligence covers five areas:
- Geographic reach — which markets is this content actually reaching, and at what volume?
- Age and gender breakdown — does the audience align with the demographic a sponsor paid to access?
- Income and interest profiling — affinity data that goes beyond basic demographics and informs sponsorship fit
- Channel-level audience data — broadcast viewers, OTT subscribers, and social audiences behave differently and carry different commercial value
- Cross-market comparisons — for brands managing sponsorships across the UK, Germany, and the US simultaneously, territory-level breakdowns are non-negotiable
When Shikenso partnered with the Belgian Pro League, audience intelligence needed to work across all 29 clubs — each with different broadcasters, different regional audiences, and different digital footprints. A unified view across that structure requires a platform built for multi-property scale from the ground up.
What Multi-Modal Measurement Changes in Practice
All four tracking layers — visual, audio, legible, and audience — feed into each other. Separate them and you get four useful metrics. Run them together and the media value figure changes substantially.
Take one scenario:
Your brand logo appears on screen for 90 seconds during a match.
- Visual: Pitch-side board placement, 65% full-frame visibility
- Audio: Commentator mentions the brand by name twice during that window
- Legible: Brand appears in the broadcast lower third during a penalty decision — one of the highest-viewership moments of the match
- Audience: 1.8 million viewers aged 25–34, concentrated across Germany and the UK
The media value, audience quality, and contextual weight of those 90 seconds each produce a different number. A raw duration figure captures none of that.
When MOONTON Games needed visibility across its global esports portfolio, that approach identified €115 million in branded media value — a figure that requires tracking across every dimension, not just one.
Where traditional measurement methods take 8–15 hours of work per report, AI-driven tracking delivers real, defensible figures in hours — with consistent methodology across every piece of content, no variation between analysts, no gaps between markets.
A sponsorship report that only covers logos is missing most of what was measured. Visual exposure alone doesn't account for audio reach, persistent text assets, or whether the audience watching matched the one being targeted. Each of those gaps means sponsorship investments are valued against an incomplete number — and renewal conversations are based on figures that don't reflect the full picture.
Accurate measurement requires tracking all three dimensions. Anything short of that is a partial report.
Book a walkthrough. We'll show you what your current sponsorship is delivering across visual, audio, and text — across every channel it reaches.

Related reads


Get new insights straight to your inbox
Don’t miss out on the insights that the press and media rave about!